Monitoring Web Services Locate
You can monitor three different aspects of a Web service through the Administration Console:
Debugging - Set the Debug Mode to view the SOAP conversation between client and server. This facilitates error fixing.
Performance - Enable the Performance Mode to view the time the service endpoint takes to return a response after receiving a request. The unit of measurement is milliseconds.
Data Throughput - The Data Throughput mode measures the number of bytes the service endpoint receives and sends.
All three functions are accessed through the Web Services Monitoring form. The following steps load this form:
Click the Web Services tree node of the Administration Console. This loads the Runtime View.
Click on the service endpoint or instance you wish to monitor. This loads the Web Service Management form.
Click on the Web Service Monitoring button in the upper section of the Web Service Management form. This loads the Web Services Monitoring form.
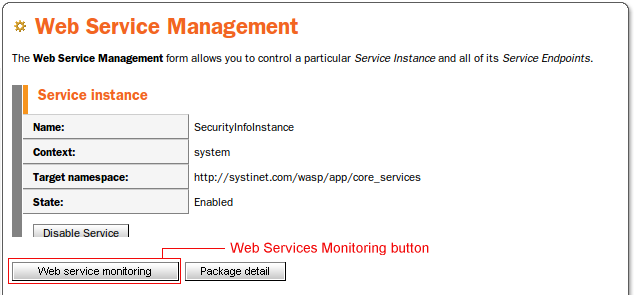
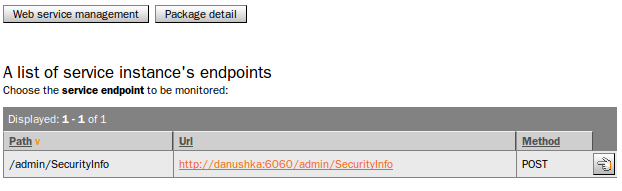
The Web Service Monitoring form contains buttons to Enable or Disable debugging and performance and data throughput monitoring. Note that at the top there are buttons for returning to the Web Services Management form or going to the Package Details form, which is a single location for package management and Web service security management. The situation after clicking the Web service monitoring button is seen on the following picture.
Performance Monitor Locate
The following picture shows the captured data after running the attachments demo.
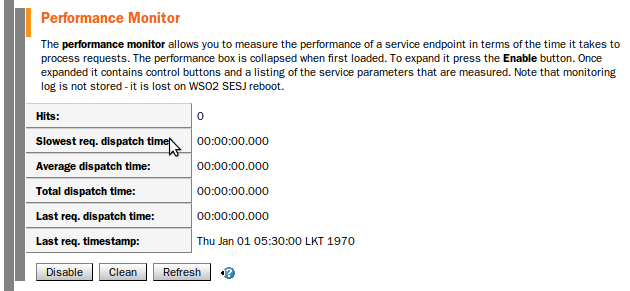
Time values are displayed in the milisecond precision as the System.getCurrentTimeMillis() method is used. Dispatching of the message starts when intercept of perfomance measuring interceptor is invoked. Dispatching of a message is considered finished when the real transport socket is closed. Dispatch time is counted from the start and finish time of dispatching.
In the following, there is an explanation of terms used in partial rows of the table:
Hit - the number of finished requests for a given path (connection.getURI().getPath()). The request means a message that comes in; the dispatch time is calculated when a response left the server.
Fastest req. dispatch time - the fastest dispatch time so far registered.
Slowest req. dispatch time - the slowest dispatch time so far registered.
Average dispatch time - Total dispatch time / Hits
Total dispatch time - Sum of all dispatch times for all requests for a given endpoint. If one request was processed, then total dispatch time = last dispatch time = fastest dispatch time = slowest dispatch time. If two requests were processed, then total dispatch time = fastest dispatch time + slowest dispatch time and last dispatch time = either fastest dispatch time or slowest dispatch time.
Last req. dispatch time - dispatch time of the last finished request.
Last req. timestamp - timestamp of the last dispatching finish.
Total dispatch time is a sum of more individual dispatch times for more requests; last, slowest and fastest dispatch time are specific values from the set of all dispatch times.
Data Throughput Monitor Locate
The following picture shows the captured data after running the attachments demo.
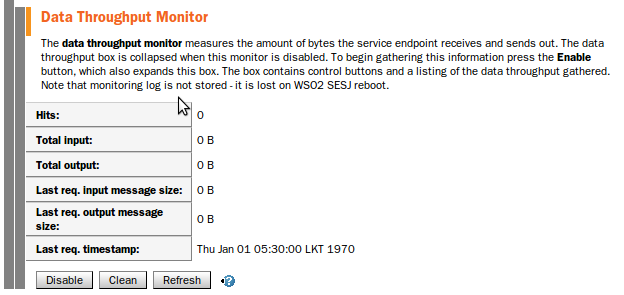
Meaning of individual items from the table is obvious from their names.